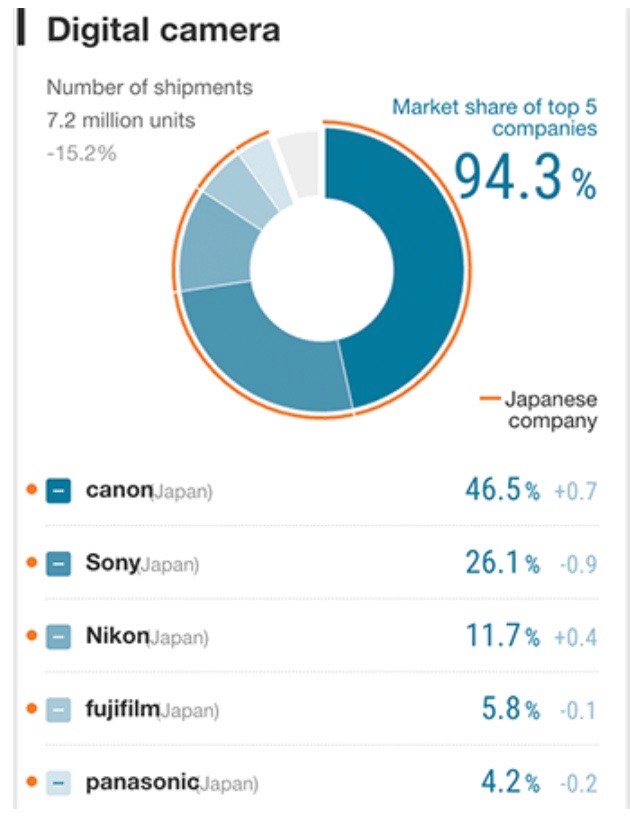
There's a graphic making the rounds of photo Web sites that comes from a Nikkei article (behind a paywall) about the global camera market. The graphic looks like this:

Many of the narratives that are being discussed about this chart are littered with confirmation bias as well as a fair amount of misreading.
First up, look over in the top left: we're talking about camera shipments (units), and that number doesn't actually line up with CIPA's stated number (Nikkei says 7.2m, CIPA says 8.0m). So right up front I need to know about how Nikkei determined their number. It seems to include DSLRs and compacts, but then it doesn't match CIPA, so was this retail sell-through, and how was that determined?
That makes a bit of a difference, because all five of the companies noted sell a combination of camera types. Canon and Nikon still sell DSLRs. Canon, Sony, Nikon, Fujifilm, and Panasonic all sell compact cameras. Yet most of the commentary I've seen about this chart tries to frame it as meaningful to current mirrorless camera sales. CIPA tells us, though, that 31% of the interchangeable lens camera sales were DSLRs, which tilt to Canon's and Nikon's favor in terms of market share.
While I've reported market shares in the past—indeed, was about the only photography site doing that in the first decade of this century—I look at market shares a bit differently than I see other sites writing about them. Most see these numbers as a reflection of current success. I don't. Market shares tell us two things, basically: a historical perspective, and the trends over time tell us about potential future shifts.
That historical bit is really important, as these numbers were for calendar year 2022, and here we are getting ready for the final holiday-driven months of 2023. In other words, if we're to believe Nikkei, we "know" what happened last year, but that's not "current".
Nikkei also reports change from 2021 (the percentages in the rightmost column), which is a bit towards what I suggest as predictive nature of market shares. If you see clear shifts in a direction over time, you can tell something about the healthiness of the sales of one company or another.
I've been tracking market shares for decades now. This started as a possible PhD thesis topic, but then quickly just grew into casual curiosity. The interesting thing to me is that the combined percentage of the "big three" has almost always worked out in the 80-90% range (according to Nikkei, it's currently 84.3%). This is a bit of a ratification of the Reis and Trout theory about markets. They claimed that the top two in a market should be clearly profitable and sustainable, that beyond that it might be better to figure out how to segment the market and take the top share of that.
If you look at the historical data, you can see just that happened: with Canon and Nikon consistently taking ~75%+ of the DSLR market, Sony took a detour into mirrorless. That worked (though I'd suggest that two other factors came into play that they lucked out on). The #1 Canon, #2 Nikon, #3 Sony shares in ILC basically flipped during the last decade to #1 Canon, #2 Sony, #3 Nikon.
If you look at the change in market share from 2021 to 2022, though, this appears to say something predictive to me, though not knowing where Nikkei's numbers come from and how they were vetted gives me great pause.
Canon's "good" 2022 might be explained by new cameras and a clear commitment to mirrorless: R10, R7, R5 C, R6 II. But Sony introduced almost as many new cameras that year: FX30, ZV-1F, A7R V. But Nikon only introduced the Z30. So you'd have to conclude there's something else driving the small swings in market shares. Again, if Nikkei's numbers are correct ;~).
Unfortunately, you have to have solid data sources that are verifiable, and a solid history of them to make any real conclusions. The only thing I take from Nikkei's article and charts is just another verification point that the Nikon and Sony positions switched, and given how dramatically and consistently in the past couple of years, perhaps permanently.
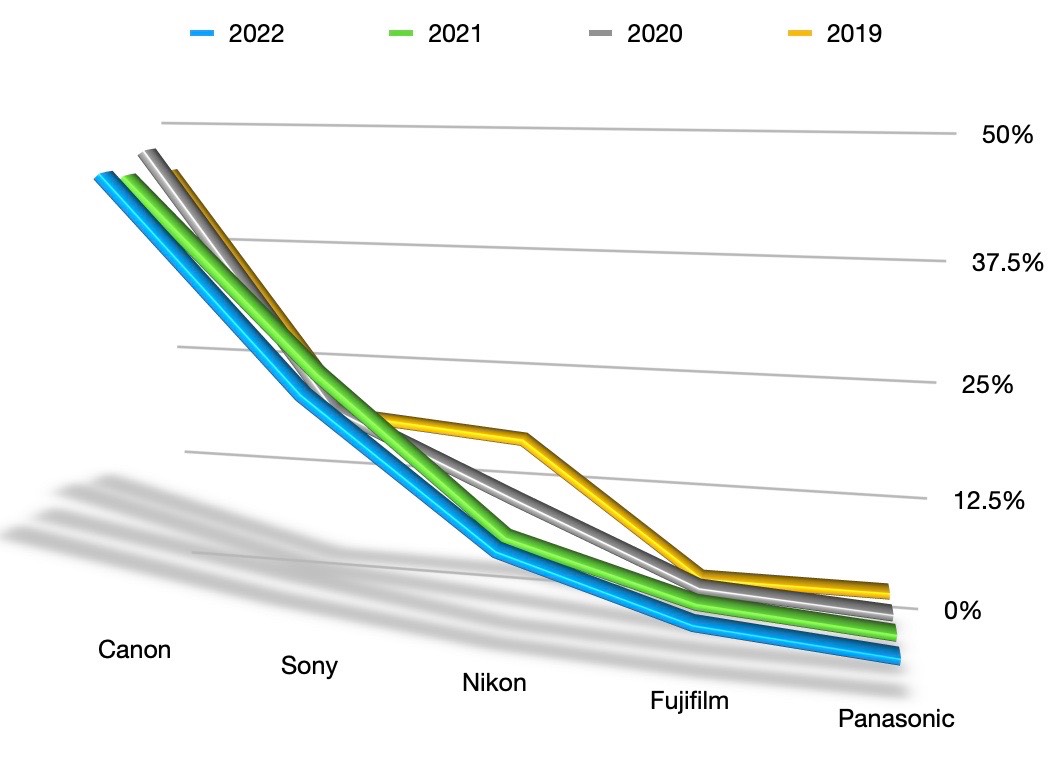
By the way, here's a chart of the last four years of Nikkei's yearly claims:

The only thing the above chart really shows is the tail end of Nikon's contraction from being #2 down to its current (two year confirmation) #3 volume.
The funny thing is that on the fan sites you can see people lamenting over how terrible (or good) these numbers are. Some are trying to dismiss ongoing compact and DSLR sales, some are trying to explain a 0.9% drop without understanding the numbers, some are just outright declaring wins and losses when, from company financial reports, it's pretty clear that at least the top four companies are producing clear profits (Panasonic is the exception because they bury their camera information in with other products and it's unclear how cameras are doing by themselves).
---------------
If you're an OMDS or Ricoh/Pentax fan, Nikkei's complete numbers put OMDS at 3.5%, Ricoh/Pentax at 0.8%.
And if you really want to be complete, Apple and Samsung both individually sold over 220 million more "cameras" than did Canon in 2022 ;~).